The Trading Cube Details
The Trading Cube is a snapshot view of the qualified trends for a stock, stock sector and the general market. It visually describes the technical health from a trending perspective. The following is descriptive written comments on what the Trading Cube is and How to Use it.
The Trading Cube
If you are trading Alcoa, you can't just look at a short term chart of Alcoa to trade Alcoa without every looking at the intermediate or long term charts or the sector and the general market. To do so necessarily increases the risk that the trade fails because trend is unique to each time frame and they are not necessarily the same.
To carry the though further, Alcoa is a basic materials stock. If basic materials have falling out of favor, that will have an influence on the price of Alcoa's shares. To repeat, to trade Alcoa without looking to see what the basic materials sector is doing once again necessarily increases the odds that your trade fails. Furthermore, you need to look at all three time frames.
Finally, what is true of the basic materials sector is also true of the general market. If you are trying to buy Alcoa's stock in the midst of a bear market, good luck. Again, you need to understand the trends on the differing time frames for the general market as well.
Thus, to effectively trade Alcoa and to increase your odds for success in the trade, you need to examine 9 charts, not 1, and you need to determine the qualified trend on all 9 charts. No trader does this - they don't have the time nor the tools. The Trading Cube is the tool and it presents the data in such a way that you can do it in seconds. What's more, it presents trend in two flavors - "strong" and "weak", "confirmed" or "suspect". The Trading Cube is a huge benefit to the trader. Its use necessarily increases your odds for success.
Below is a snapshot of the trading cube for Alcoa. In this snapshot you can see a cube. On the surface of the cube you find the trend. The row furthermost to the bottom of the page is the trend for the stock - in this case, Alcoa. Just above it, there is a row representing the sector that Alcoa trades in; the Basic Materials Index. The topmost row is the trend for the general market. Alcoa trades on the S&P 500.
Each row is divided into three parts/columns with the leftmost column being the short term trend (a 3-month) view. The middle column is the intermediate term trend (1 year weekly view) and the rightmost column is the long term view (5 years of monthly data).
The trend can be bullish (suspect or confirmed), sideways (suspect or confirmed), or bearish (suspect or confirmed). Suspect is denoted by red lettering while confirmed is denoted by green. Confirmed implies that the current trend is likely to continue. Suspect means it is suspicious and can't be trusted.
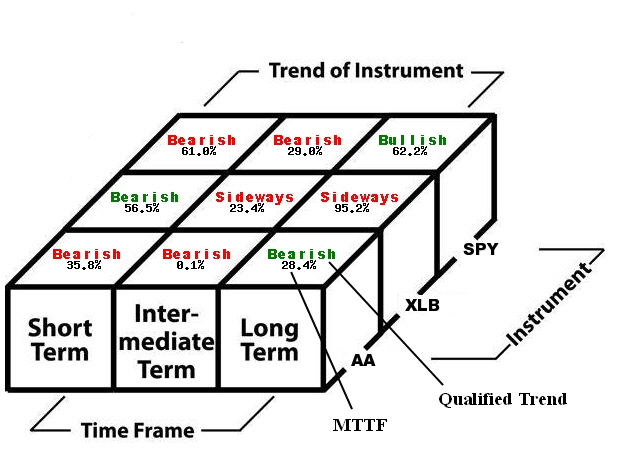
In the Trading Cube there are qualified trends for the stock, the stock's sector and the general market across three time frames. Essentially this is a snapshot view of 9 charts in one compacted view. In addition to qualified trends, there is a measure of cumulative MTTF for each of these qualified trends. Click here to read more about MTTF and its construction and value.
